

Sharing data is fundamental to the web’s utility, yet it is often challenging to present this information in an easily digestible format. Simply providing large amounts of raw statistical data in text form makes the information available, but it is not user-friendly.
Therefore, effective information sharing relies not only on the data itself, but also on how it is presented.
Fortunately, WordPress plugins offer various solutions for both calculating and displaying diverse data types. Below are some tools designed to help you visualize information in an appealing and attractive way.
wpDataTables – Tables & Charts in WordPress
wpDataTables is a powerful tool for data visualization. Simply import your custom data (CSV, Excel, JSON, XML, and more) and select one of the 14 available chart types to present the information to your visitors.
Interactive Geo Maps WordPress Plugin

To display geographic data beautifully, use Interactive Geo Maps. These responsive and interactive maps let you customize your presentation, for instance, by coloring specific countries (including hover effects), integrating useful hyperlinks, and showing tooltips on interaction.
iList Infographic Maker for WordPress
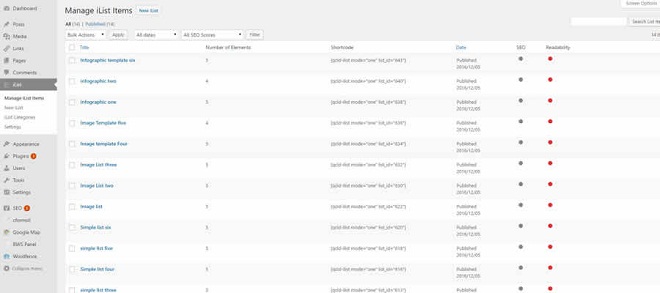
With Infographic Maker, you can create stunning infographics and listicles without leaving WordPress. This tool supports all sorts of content, including charts, and is designed to integrate natively with the Gutenberg block editor, making creation fast and flexible.
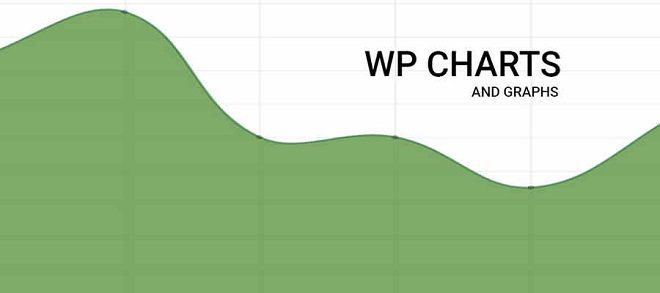
With WP Charts and Graphs, you can create diverse visualizations—like bar, pie, polar, and radar charts—using a visual builder that features real-time previews. The finished charts can then be added to your content efficiently.

EmbedPress is the ultimate tool for handling visual data, offering easy embedding from over 100 sources (like Google Docs, Wistia, and Spotify). It works with the Classic Editor, Gutenberg, and Elementor, and can even display local files such as PDFs in your posts. Upgrade to Pro for custom branding features.
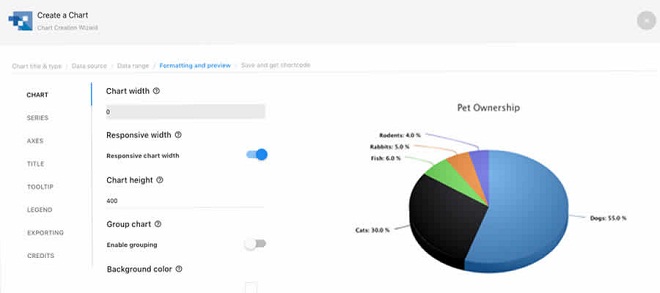
Use M Chart to create stunning visualizations by entering your data via a convenient spreadsheet-like UI. This plugin lets you choose from multiple chart types and gives you control over the rendering engine, allowing you to use either Chart.js or Highcharts.
Visualizer – Tables & Charts Manager for WordPress
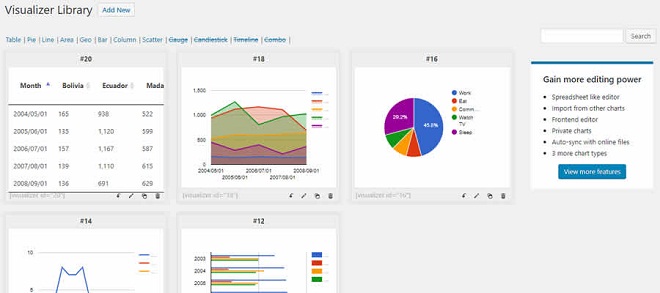
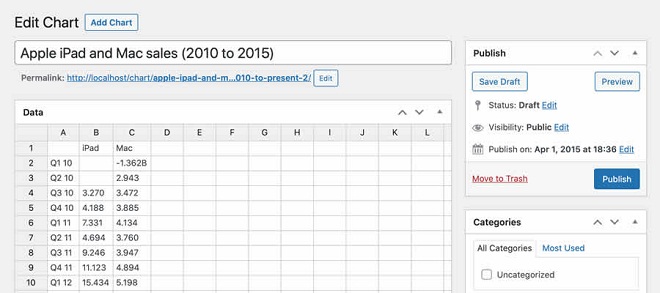
You can create a total of 12 distinct chart types with Visualizer, such as line, bar, area, column, pie, and geo charts. Data for all these visualizations can be imported quickly and easily using a standard CSV file.
Data Tables Generator for WordPress
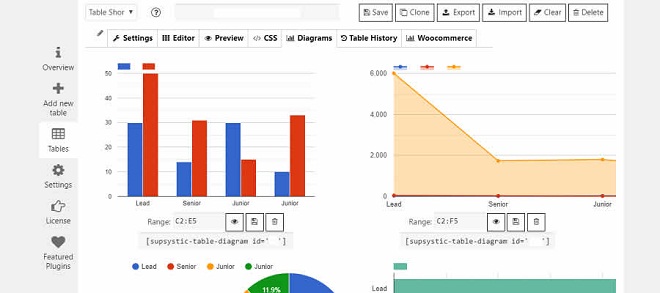
With Data Tables Generator, you can build dynamic, sortable tables directly inside WordPress using an interface similar to Excel. A key feature is the ability to attach charts to your tables. Furthermore, it provides front-end users with the option to export the tables in various file formats.
Responsive Mortgage Calculator for WordPress

While complex charts and tables can sometimes obscure data, the Responsive Mortgage Calculator cuts through the complexity. It takes the often complicated task of figuring out mortgage loan terms and makes the process incredibly simple and straightforward for the user.
Calculated Fields Form WordPress Plugin

Calculated Fields Form is perfect for dynamically generating results driven by user input. You can create a wide range of specialized calculators, covering everything from pricing and weight to dates, percentages, and general numerical calculations.
About Author
Eyden Haze
Eyden Haze is a digital marketer, a web designer and technology fanatic from Sydney, Australia. With over 7 years of experience in web industry, he has helped his clients to launch their marketing campaigns successfully. He also likes to explore various online tools and share that knowledge by writing useful blog posts.