

Sharing data is a fundamental pillar of the modern internet, yet translating complex numbers into a format people actually want to read remains a challenge. If you simply post walls of raw statistics, the information is technically “there,” but it’s far from being accessible or engaging for your audience.
The reality is that effective communication requires more than just accurate data; the visual delivery of that data is just as critical as the facts themselves.
Fortunately, WordPress offers a variety of specialized plugins designed to automate both the calculation and the visual arrangement of your metrics. Below, we’ve highlighted several powerful tools that transform dry data into compelling, interactive visuals.
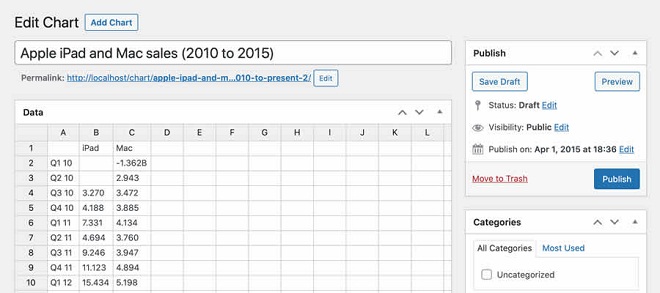
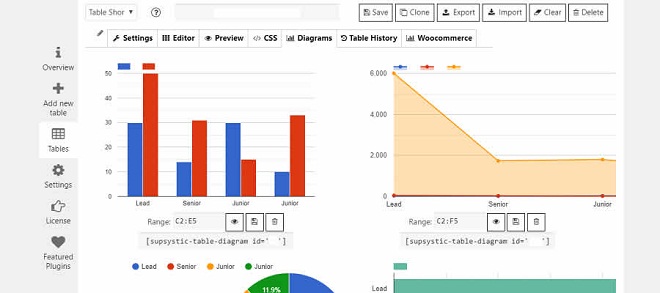
wpDataTables – Tables & Charts in WordPress
Interactive Geo Maps WordPress Plugin

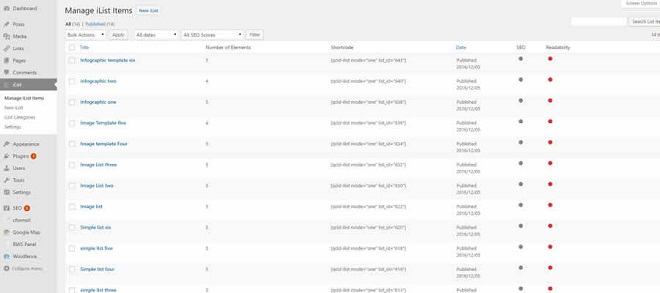
iList Infographic Maker for WordPress

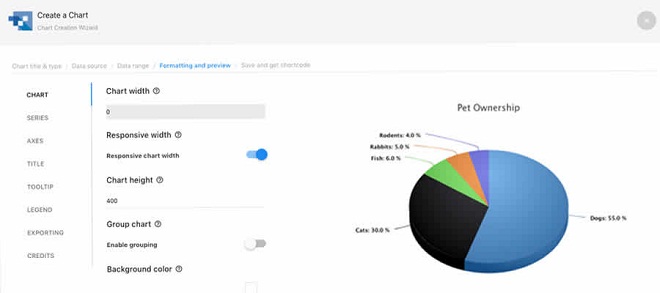
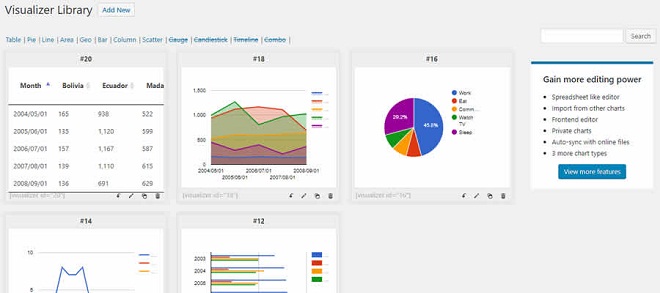
Visualizer – Tables & Charts Manager for WordPress
Data Tables Generator for WordPress
Responsive Mortgage Calculator for WordPress

About Author
Eyden Haze
Eyden Haze is a digital marketer, a web designer and technology fanatic from Sydney, Australia. With over 7 years of experience in web industry, he has helped his clients to launch their marketing campaigns successfully. He also likes to explore various online tools and share that knowledge by writing useful blog posts.